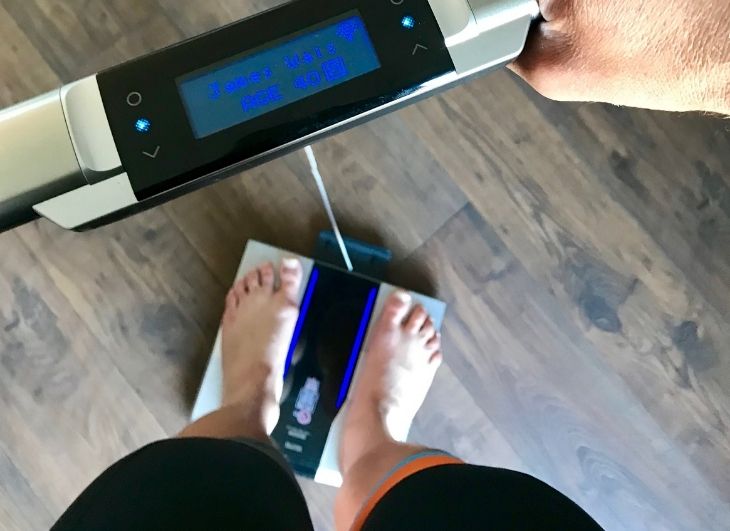
The good old trusted scales. They’ve been around for years. Some can be found covered in layers of thick dust in bathrooms and some can be found calibrated incorrectly and used daily to provide individuals with a figure which is often translated into ‘this is how much fat I have’. Of course, this couldn’t be further from the truth.
So, 1. Why can’t the scales tell how much fat mass I have? 2. How do I know if I am losing fat and not muscle when I am trying to lose weight and 3. how do I know if I am burning fat when I train? FYI: questions 2 and 3 will likely be answered together later on.
Some brilliant questions there if I do say so myself ;-).
To start with, let’s be clear here, the scales can be an important tool to use when working in the field, and knowing an athlete’s body weight is important for a number of performance nutrition areas e.g. calculating macros, replacing sweat loss, tracking/monitoring overall weight loss/gain. However, there are many, many factors that come into play when discussing changes in an individual’s weight. For example, consuming a carbohydrate-rich meal can increase water retention, emptying your bladder and bowels will likely see drops in bodyweight, for women, monthly cycles can influence fluctuations in the scales and many, many more!
In addition, when hoping to drop a few kilograms of body weight (fat mass), to some extent, you will always lose some muscle mass along with it. The scales can’t tell the difference. You are after all restricting the body of nutrients: something has to give. That being said, over-restrictive diets are going to be more detrimental to losing soft tissue aka skeletal muscle, and the aim is to not lose muscle mass, not in large amounts anyway! Those of you who are actively seeking out published journal articles on calorie deficits or doing research around changing body composition will often find that the subjects used within the studies were assessed using fancy lab-based equipment e.g. DEXA scan (Dual x-ray absorptiometry) or a bod pod (water submersion). This type of equipment is found in university laboratories for educational and research purposes. They are also ridiculously expensive to purchase. The DEXA is considered the ‘gold standard’ method for assessing an individual’s body composition. It should be noted now though, that there is no 100% valid method for measuring someone’s body fat percentage, unless they were deceased, and you drained their body fat…. bit dark, but a valid point.
So, let’s assume we don’t have access to the DEXA, what’s the next best thing to tell you if you’re losing fat? Field-based practitioners will actively use skinfold measurements to assess, monitor and track an individual’s changes in fat loss/gain. Registered performance nutritionists will have had specific training in this area, which is essential because this assessment can be horribly invalid and a waste of time if not conducted properly. It involves taking skinfold measurements at multiple landmarks of the body, including measuring height, weight and taking bone girth measurements. A lot of individuals I discuss this with will wince of the thought of conducting this assessment but it’s a good assessment to use and although it might sound painful, it’s really not. This assessment is often conducted every 2-4 weeks and the results are used to reflect any necessary changes in dietary intake to aid fat loss.
To encourage fat loss and to have a better understanding of how efficient you are in oxidising different energy substrates when you train e.g. fat and carbohydrates, as energy sources, there is a test that can be conducted to help find this out. Sports physiologists will conduct an assessment called the FatMax test. This assessment helps to find your optimal fat burning zones. These fat-burning zones are highly individualised (which is why we test/assess) – see diagram 1. This diagram was taken from Asker Jeukendrup’s website: www.mysportscience.com. Not repping him or his work but I highly recommend anyone who is interested in sports performance nutrition to check out his work. Diagram 1 details exactly how individualised fat burning zones are between athletes.
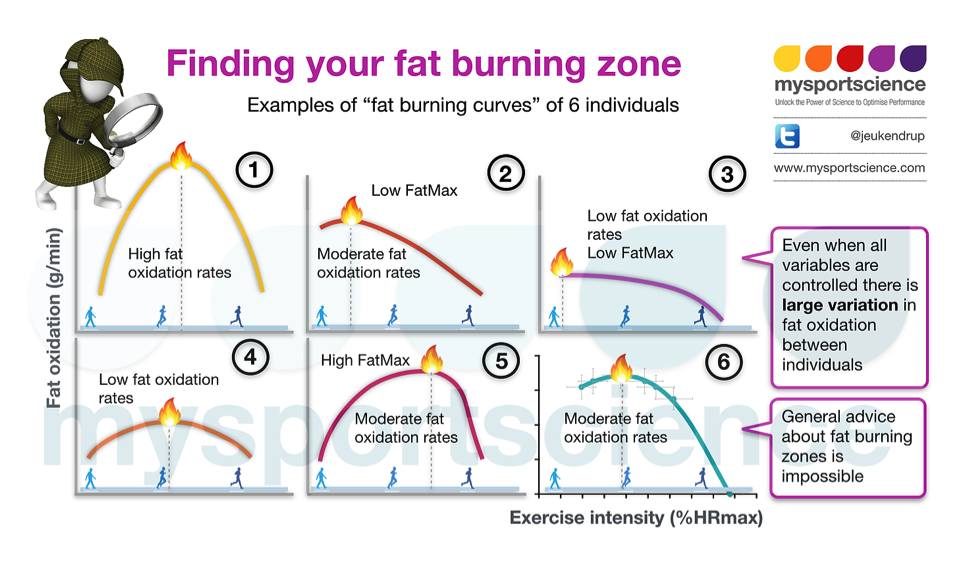
Diagram 1 – taken from www.mysportscience.com
A key factor in finding out the difference between how we shift between oxidising different energy substrates is the intensity of the exercise. In diagram 2 shown below, Jeukendrup details the process in how FatMax is assessed, and how the shift between fat oxidation and carbohydrate oxidation shifts as exercise intensity increases. To quickly summarise the diagram and what is happening, I have included some bullet points below:
• An athlete is hooked up to tubes and fancy bags (Douglas bags) that collect and measure the athletes O2 intake and CO2 output.
• This data is translated to determine how much carbohydrate and fat is oxidised according to that individual athlete.
• In diagram 2 (see below), the athletes lowest recording of fat oxidised g/min is between 0.35 and 0.175g/per minute and ~65%HRmax (Heart rate max).
• As the individual moves from walking to running (increase in intensity), the athlete’s peak FatMax is recorded above 0.525. (Remember, this is an example, precise figures are not shown, and the results are unique to this athlete).
• Finally, as the athlete moves from running to running faster/sprinting (increase in exercise intensity), the fat oxidation rates begin to decrease as the %HRmax increases. This will be where the athlete begins to move from oxidising fat to oxidising carbohydrates as an energy fuel.
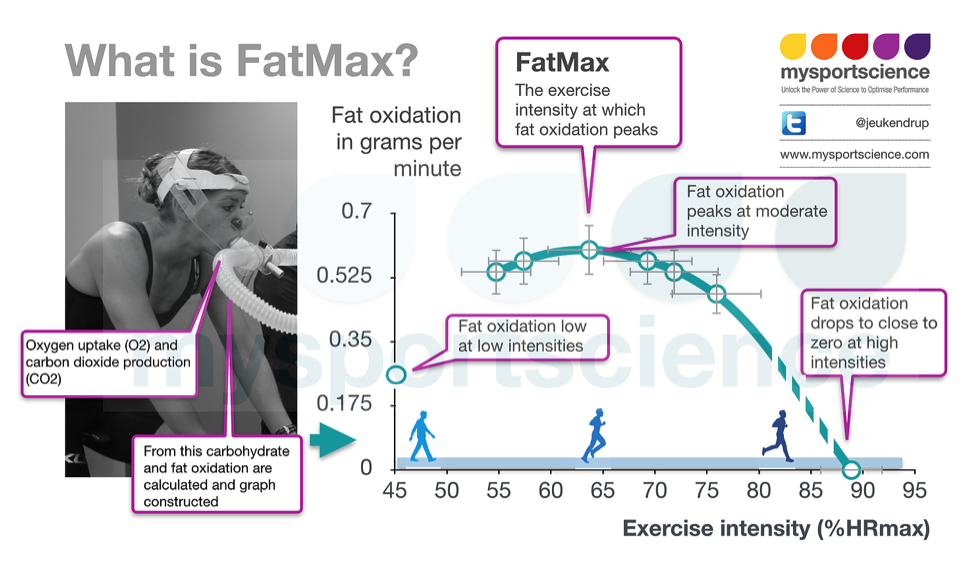
Diagram 2 – taken from www.mysportscience.com
To summarise, research has shown that the average individuals (again, average individual, not personalised to you) fat oxidation peaks between 50% maximal HR to 80% maximal HR, giving an average of ~65% – a MASSIVE variation, right!
After reviewing some of the science behind weight loss, from a physiological perspective but whilst also tipping our hats to the science, I need to remind you (without sounding patronising!) that the next time you’re on a treadmill/static exercise bike at home or at your local gym and the machine is telling you ‘you’re in your optimal fat burning zone’ you can have a little chuckle to yourself because the only way of truly knowing your individual FatMax zones are by assessing, with the correct calibrated equipment, by accredited professionals. The same goes when listening to Bill or Barbara in the office who are bragging in the office about losing 2kg of fat after training in their Fatmax zones because their treadmill told them so…..shakes head and sighs.
That’s it again for this month’s blog release. Like the others, I enjoyed writing this one for you and I hope you enjoyed the read. As always, if you did enjoy it, please give it a like and feel free to leave a comment. Don’t forget, you can sign-up to my blog releases via my website – the pop-up will appear after about 5 seconds. The next blog will be part 3 of the weight loss vs performance series. Don’t hesitate to get in touch if you have any questions or want to enquire about working together.
Talk soon.
J


